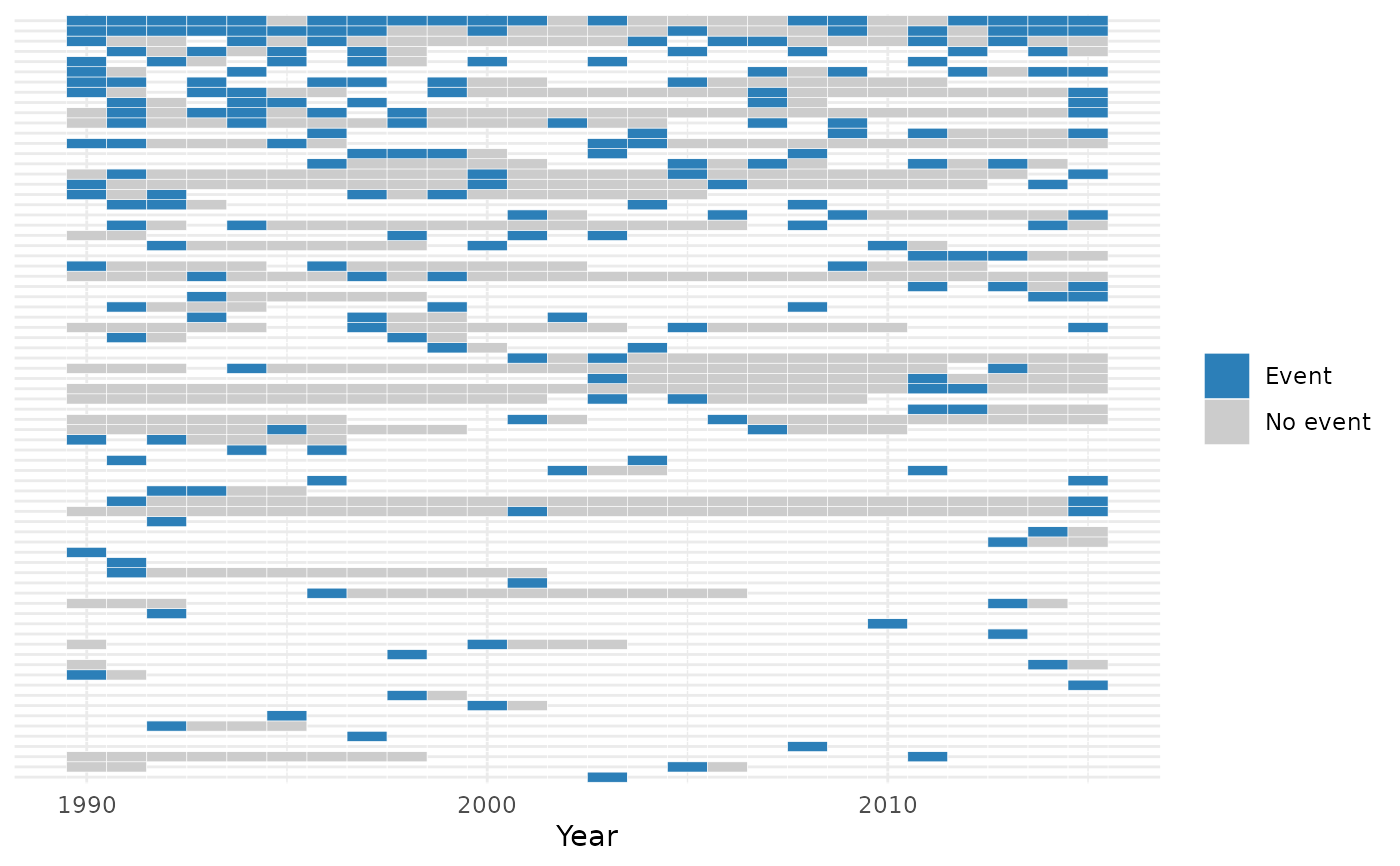
Plot country-year onset/event coverage of a binary variable
Source:R/plot_coverage.R
plot_coverage.RdDraws a country-by-year heatmap of a binary (0/1) event column: 1
years are shaded as an event, 0 years as no event, and years where the
state does not appear in panel at all (e.g. before independence) or
var is NA are left blank. Useful for eyeballing when and where
events (e.g. conflict onsets) actually occurred, as opposed to just
where a source has any data.
Arguments
- panel
A data frame produced by
build_states_panel(), containing acoworgwcolumn, ayearcolumn, andvar.- var
Character. Name of a binary (0/1) column in
panel, such as"ucdp_prio_onset".- drop_empty
Logical. If
TRUE(default), drop states with zero years wherevar == 1before plotting. A state that never has the event contributes a row with no blue tiles at all, which adds clutter without showing where/when events happened; set toFALSEto include these states anyway.- show_labels
Logical. If
TRUE(default), label each row with its country (orcow/gwcode, ifpanelhas nocountrycolumn). Set toFALSEto drop these labels, which otherwise overlap and become illegible oncepanelcovers more than a few dozen states.
Value
A ggplot object (one tile per country-year, filled by
"Event" / "No event", with unobserved country-years left blank).
States are ordered top-to-bottom by their number of events, most first.
Requires the ggplot2 package.
Examples
if (requireNamespace("ggplot2", quietly = TRUE)) {
  build_states_panel(1990, 2015, coding_system = "cow") |>
    add_conflict("ucdp_prio") |>
    plot_coverage("ucdp_prio_onset")

  build_states_panel(1990, 2015, coding_system = "cow") |>
    add_conflict("ucdp_prio") |>
    plot_coverage("ucdp_prio_onset", show_labels = FALSE)
}